While working with IoT in general and Azure IoT Edge more specifically, you will always encounter multiple kinds of communication protocols, both in the cloud and on the edge.
So, it is time to dive into this protocol by running an MQTT broker on the edge and consuming it:
Yes, we are going to deploy a regular MQTT broker as a docker container within Azure IoT Edge (which uses Moby under the covers). Then, we bridge messages sent to MQTT topics to the cloud using Azure IoT Hub.
For this exercise, I have chosen HiveMQ as a broker.
Azure IoT Edge runs on both Windows 10 and Linux, let’s talk about how to set up that Azure IoT Edge runtime.
The current LTS 1.1.* version of Azure IoT Edge still supports Windows containers on Windows devices.
The newest version of Azure IoT Edge, the 1.2.* version supports running only Linux containers on Windows. This is called EFLOW (Edge for Linux on Windows).
So, Microsoft supports both Linux containers on Linux and Windows too. Technically, you have to write only one solution running on both operating systems.
Still, you have to build and push separate container versions of the same logic based on the processor architecture.
Azure IoT Edge runs on most flavors of (Linux) operating systems that can run containers; however, not all of these systems are equally supported. There is documentation available with an up-to-date list of supported operating systems. Check out if your operating system gets either Tier 1 or Tier 2 support.
As an example, Ubuntu 20.04LTS is currently not officially supported in Tier 1.
Update 21-10-2021: During the recent Azure IoT Edge Summit – Technical Track it is announced Ubuntu 20.04 is on the product team near term roadmap and coming soon.
Still, the Azure IoT Edge runtime can be installed and is considered compatible.
That runtime is built up in a few parts:
A daemon (process) that secures the runtime and start the local part of an Azure IoT Edge solution
The open-source Moby container runtime where the modules will be hosted in
A local directory structure for configuration
Regarding the installation of the runtime, you can follow the original documentation.
This guide does not point you to a simple installation. You need to have technical skills to roll out the runtime. And the rollout is done by hand.
Now, a script is provided and maintained by the Microsoft product team that can be used to automate the roll out of the runtime, including support for DPS.
IoT Plug and Play enables solution builders to integrate IoT devices with their solutions without any manual configuration.
It introduces a model as a public description of a device. This device model advertises the capabilities of the logic on your IoT device like telemetry, properties, and commands. These elements are bundled as an interface. These interfaces are described using the Digital Twins Definition Language (DTDL).
Implementing IPnP in your solution is not that hard. The Azure IoT Device SDKs have you covered. Just interact with the cloud as usual. Only, when setting up the connection, the device exposes a ModelId. This id is compared with public models available in a repository so the actual model can be restored.
Next to direct-internet-connected devices, Azure IoT also support this concept of edge compute:
The way Azure IoT Edge devices are connected to the cloud differs quite a lot.
Azure IoT Edge devices lack the support for a ModelId. So there is no direct reference to any model is a model repository. But each type of edge device comes with a Deployment Manifest, describing the logic to be rolled out on the edge device and related settings.
These differences have an impact on how to implement IoT Plug and Play device templates.
Let’s see how to get started with IPnP for edge devices in IoT Central.
Recently, I have shown how to interact with Prometheus metrics on the edge, provided by the Azure IoT Edge runtime.
The built-in edge Metrics are great for analyzing what is currently going on in the containers (CPU usage, memory usage, restarts, etc) and on the host (CPU usage, disk usage, etc.).
Since then, this metrics solution is expanded with Azure Monitor workbooks in the Azure portal so we are able to show the metrics in dialogs within Log Analytics workbooks.
Microsoft introduces this extra Metrics collector module. It is already available in the Azure IoT Edge Module marketplace.
Note: this Metrics collector support is still in preview.
Today, I will show how this is done using the preferred way:
Azure IoT Edge Metrics are sent directly to Azure Log Analytics.
More than two years ago, I wrote a blog post about introducing Azure cloud security on the Edge.
This, now labeled the ‘classic’ version of Azure IoT Security, was based on AuditD and filled an important need: getting insight into the security of IoT devices.
Though, as with many things, the world moves on.
Microsoft reconsidered the solution and decided to spice it up a little bit.
They now offer a new edition supporting both an agent-based and an agent-less solution.
If you are interested (and you are when you own large networks with many devices!) in the agent-less solution, please check out this great demonstration on the Internet of Things show.
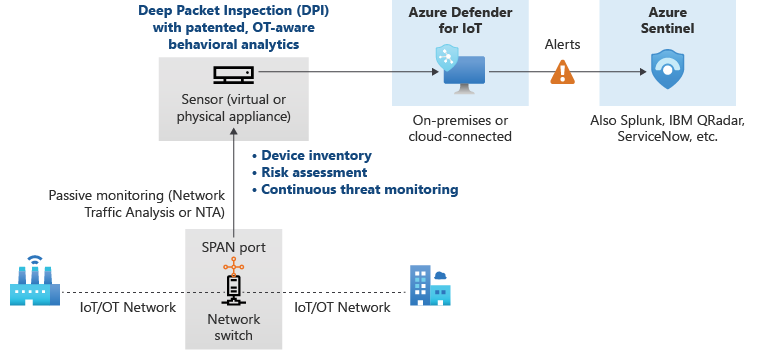
This agent-less solution is especially powerful in large solutions with many devices on the network:
You just install this Azure Defender for IoT ‘sensor’ device within the network and it starts inspecting that network for possible threats based on deep-packet inspection and updated threat-analysis logic coming from Microsoft.
In contrast, Here is shown how the current agent-based solution is rolled out:
As seen in the picture an agent, running as a daemon process on your (Linux) host (Azure RTOS is supported too), checks for possible vulnerabilities and passes it on to the cloud, to an IoT Hub.
There, the situation (and possible threats) is visualized in the Azure Defender for IoT portal panes.
When I checked out the documentation, I also expected support for Azure IoT Edge… but it seems there is no Azure IoT Edge Docker module support.
It only describes running that solution based on a daemon. This daemon is just a process that is secured using Azure IoT Device Module Identity credentials.
The identity is a separate security key apart from the Azure IoT device runtime security keys.
So, do we need to register a second Azure IoT Device, deployed side-by-side to an Azure IoT Device just to have the host secured?
Or, how can we integrate this daemon in a device running Azure IoT Edge?
NuGet packages are a beautiful addition to your .Net development environment so you can add third-party libraries to your projects with ease.
For .NET (including .NET Core), the Microsoft-supported mechanism for sharing code is NuGet, which defines how packages for .NET are created, hosted, and consumed, and provides the tools for each of those roles.
Making use of a (privately hosted) NuGet feed is also the perfect way to distribute and version your own libraries within your company projects. Then, these libraries are only accessible by you and your friends.
Due to the fact, Azure IoT Edge modules are just docker containers, you can not simply reference other projects in the same solution. This is because of the separate docker container build and push mechanism outside the scope of the projects/solution.
Recently, I did some projects using (private) GitHub repositories to both generate, host, and consume NuGet packages.
As you can see, the messages are build up in three parts:
The actual message body, generated by (your) logic in the device. This part could be encoded so only the receiver knows how to handle this. Normally this is a JSON message format, though.
(Application) properties, message enrichment on the device to provide context about the messages. This acts as a property bag, also added by the developer. The values are directly accessible for routing purposes.
System properties, added by the IoT Hub. This gives technical context about the incoming message from the perspective of the IoT Hub
So users can choose to add values in the body or to add values in the application properties.
Still, every byte put in the message sent by the device results in a longer transmit duration and extra costs (number of bytes communicated, potentially more message chunks handled by the IoT Hub).
So, values already found in the system properties (eg. the device name or module id) can be left out in the body. This results in a smaller message.
Microsoft also provides message enrichment on the IoT Hub. This can take away some of the pain too.
It also makes it possible to route messages further down the road in other Azure resources which receive these enriched messages.
Back in 2018, the Azure Stream Analytics team announced Anomaly detection for Azure Stream Analytics. And, it was also supported on the Azure IoT Edge. In November 2018, I was allowed to demonstrate this at the SPS IPC Drives in Nuremberg:
Since then, anomaly detection has become a first citizen of Azure Stream Analytics.
Azure Stream Analytics Anomaly Detection is able to ‘automatically’ detect spikes, dips, and trends in a stream of values. This is based on math and all you need to do is to specify how many values you expect and how sensitive the detection must be. It is in fact Machine Learning, in the end. So it is a prediction with a certain certainty…
And it’s just part of the Stream Analytics query language. So on the edge, we can deploy a Stream Analytics module (the engine of stream analytics). This is a fixed module from Microsoft.
All you have to do is feeding it a query, inputs, outputs and, user-defined functions if available:
We can define all this in the cloud, inside a stream analytics job and we can even test it. Those parts are then packed as a blob and put in blob storage. The Stream Analytics job can then download it and run it.
The inputs and outputs of the Stream Analytics job can be attached to the normal Azure IoT Edge routing mechanism.
Persisting incoming telemetry in a local database is useful for multiple purposes. One of them is creating a custom dashboard eg. written in Blazor.
In this blog, we explore how to deploy the popular InfluxDB. This open-source time-series database is specialized in Internet of Things usage. And on top of that, let’s explore how Grafana can be deployed on the edge too. Grafana is an open source analytics and interactive visualization web application.
We see how it can be connected to the Influx database:
As you see here, we need a custom Azure IoT Edge module (called ‘writer’) that is capable of writing incoming telemetry to the Influx database. There, the telemetry is picked up and displayed by Grafana.
We are familiar with the Azure IoT Hub metrics which are offered. The Azure cloud tells us eg. how many messages are received or the number of devices that are connected.
If we look at Azure IoT Edge, you had to collect your own made metrics in the past.
Because IoT Edge modules are Docker containers and therefore sandboxed, you had to rely on the (third-party) logic to capture Host metrics. Regarding metrics about the edge agent and hub, these were not available.
Until now.
With the most recent IoT Edge runtimes, agent, and hub, we have access to Edge metrics.
Both the Agent and Hub module expose the metrics over HTTP endpoints:
Within the Moby runtime, port 9600 is exposed on both individual modules. Outside the runtime, we have to assign individual host ports to prevent using the same host port.
Let’s see how this looks like and how we can harvest metrics in a custom container.